How to Find Your Most Engaging Content Using Google Analytics
You create content because you want visitors to engage. Visitor engagement could mean:
- Clicking on to other pages
- Spending time on a page
- Commenting and sharing
And in this post, I’ll show you how to use Google Analytics to find out which content is engaging visitors on your site.
Step One: Go to Your Content Drilldown Report
Navigate to your behavior report in Google Analytics. This report is ideal because we’re after content that generates engagement. So behavior is where we’ll find engagement data.
From there, use the drop-down menu and select “content drilldown”
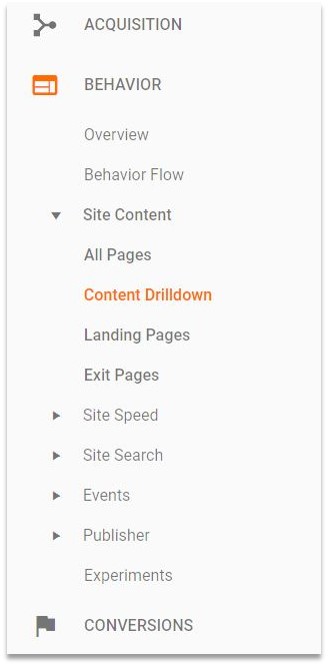
This report breaks content down by page path level one. For example:
- your-site.com/blog/
- your-site.com/downloads/
- your-site.com/clients/
It’s the subpage following your main domain.
Then, click on a subsection. Odd’s are your most engaging content is related to content marketing material, like your blog or downloads section. So start your investigating there.
Step Two – Benchmarking Engagement Metrics
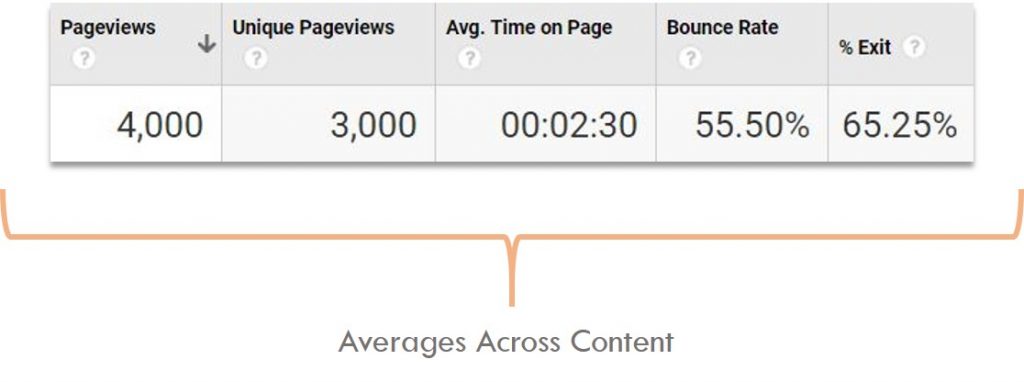
Now you’ll see detailed data for each blog. You’ll also see an overview of your data for categories like pageviews, bounce rates, and time on page.
Take your averages for each metric. These averages are going to act as a benchmark for content engagement.
Now it’s time to slice and dice your data.
Step Three – Use Advanced Filters
To slice and dice your data, click on the advanced filters link. You’ll notice it just above the metrics categories.
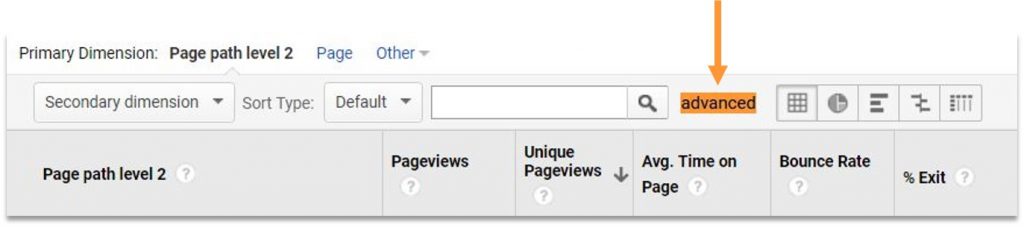
When you click advanced, you’ll see a dropdown menu. Click on it to drop down filters.
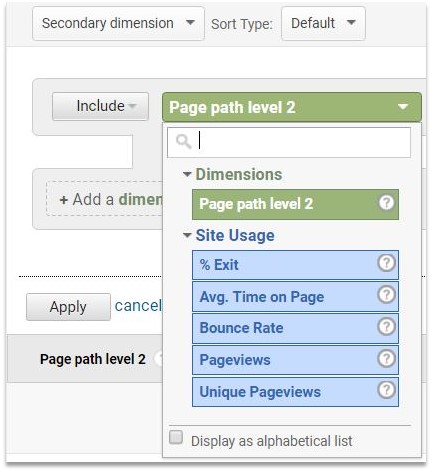
When I’m honing in on most engaging content, I like to use:
- Avg. Time on Page – How long visitors spend reading your content.
- Bounce Rate – The percentage of visitors who land on your content, and take no further action.
- Pageviews – The total number of pages viewed.
Now, use your benchmarks from step two to filter the top performing half of your content.
From step two, our benchmarks were:
- Avg. Time on Page – 2:30
- Bounce Rate – 55.50%
- Pageviews – 4,000
So, your filters will look something like this:
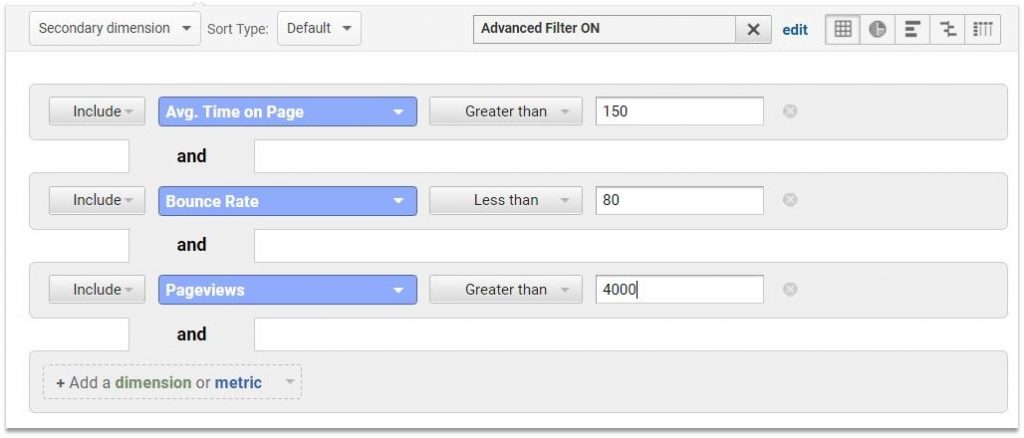
When you click apply, you’ll see the top half of your content bubble up.
Now you know how to find your most engaging content using Google Analytics.
But before you go, here’s a few tips to keep in mind.
- When tracking average time on page, convert minutes into seconds.
- No need to use a “%” sign for entering bounce rates.
- Make sure you’re setting your Greater / Less than filter correctly. Usually, you’ll use greater than for all metrics except bounce rate.
Finding Your Most Engaging Content Using Google Analytics
With this technique, you can navigate to your most engaging content. Now it’s time to optimize. Use your engaging content as templates moving forward.
And if you have any questions, let me know in the comments below.